
Fewer Listings, Longer Days on Market: How Mount Pleasant's Real Estate Market Wrapped Up Summer 2026
Single-family listings got scarcer across Mount Pleasant and Charleston County this summer, yet homes took longer to sell. Here's what July, August, and September 2026 MLS data shows for North Mount Pleasant, South Mount Pleasant, and the county, and what it means if you're buying or selling this fall.
How Did the Mount Pleasant Real Estate Market Perform in Q3 2026?
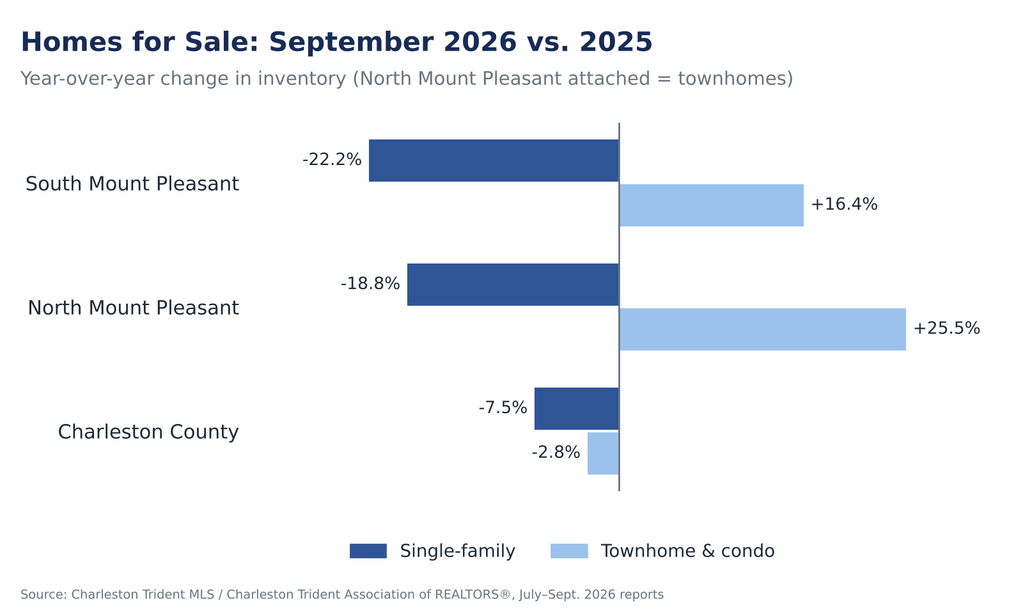
Through the third quarter of 2026, single-family supply tightened across Mount Pleasant and Charleston County while homes took longer to sell. In September, single-family inventory was down 22.2% year over year in South Mount Pleasant, 18.8% in North Mount Pleasant, and 7.5% countywide, yet days on market rose in all three. Prices held up: the September median single-family sales price was $1,375,000 in South Mount Pleasant (up 14.6%), $995,000 in North Mount Pleasant (up 3.1%), and $715,000 across Charleston County (up 1.6%). Townhomes and condos moved the other way on supply, with more homes for sale in both North and South Mount Pleasant than a year ago.
September 2026 at a Glance
Single-family prices were up year over year in all three markets in September, with South Mount Pleasant posting the largest gain.
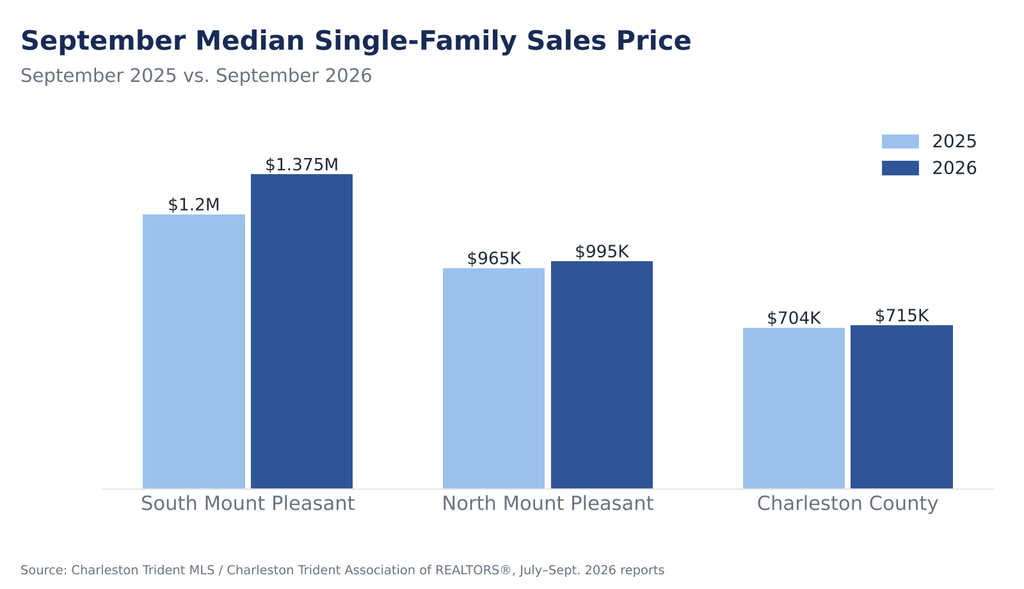
On the attached side, September medians were $490,000 for South Mount Pleasant townhomes and condos, $560,000 for North Mount Pleasant townhomes (on just 12 sales), and $457,450 for townhomes and condos countywide.
The bigger story is supply. Single-family inventory fell in all three markets, while townhome and condo inventory rose in both North and South Mount Pleasant.
How July and August Led Up to September
Homes took longer to sell as the quarter went on, most noticeably in North Mount Pleasant.
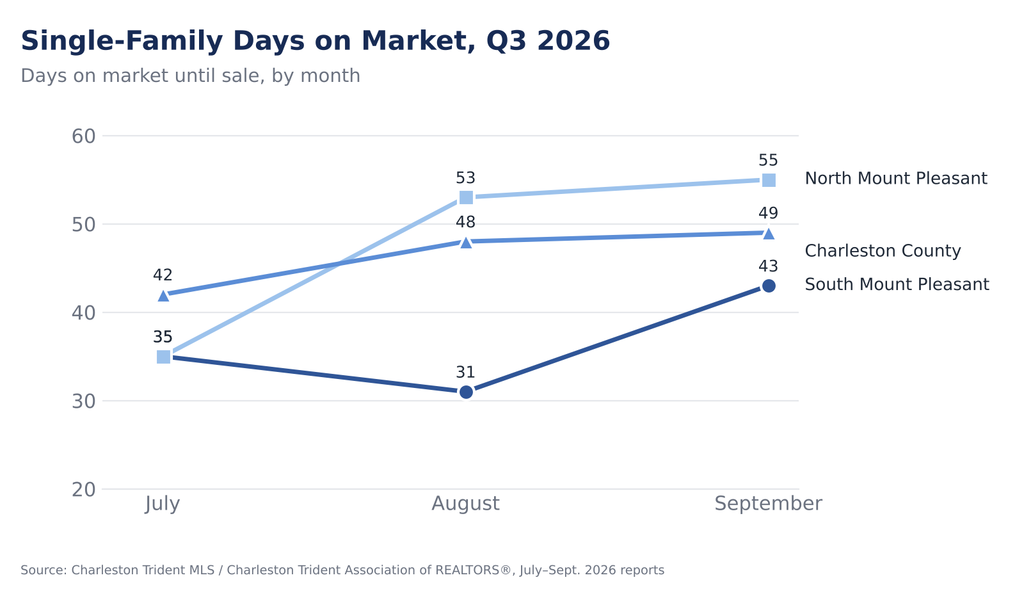
Part of that is the usual seasonal slowdown. As back-to-school schedules take over in late summer, the pool of active buyers thins, and days on market lengthened over the same months in 2025 too. The difference this year is that every month ran slower than the year before in North Mount Pleasant and countywide.
South Mount Pleasant had a busier quarter than last year, while North Mount Pleasant townhome sales slowed.
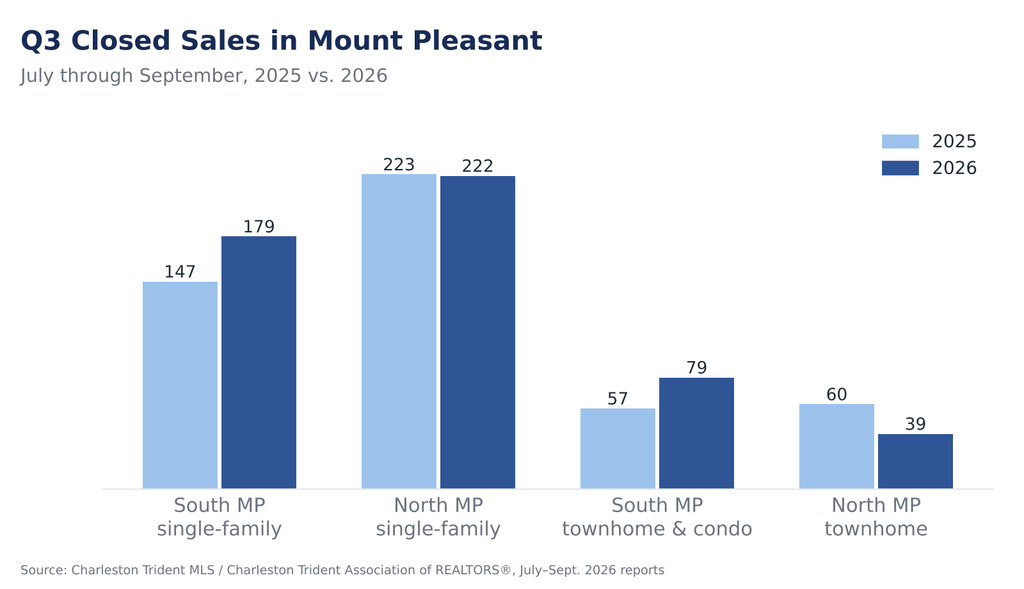
Countywide, 1,469 single-family homes and 478 townhomes and condos closed in Q3, both up from last year.
Year-to-Date Through September: The Bigger Picture
A single month's median can jump around depending on which homes happened to sell that month. Year-to-date figures smooth out those swings. North Mount Pleasant is the one area where the single-family median sits below 2025.
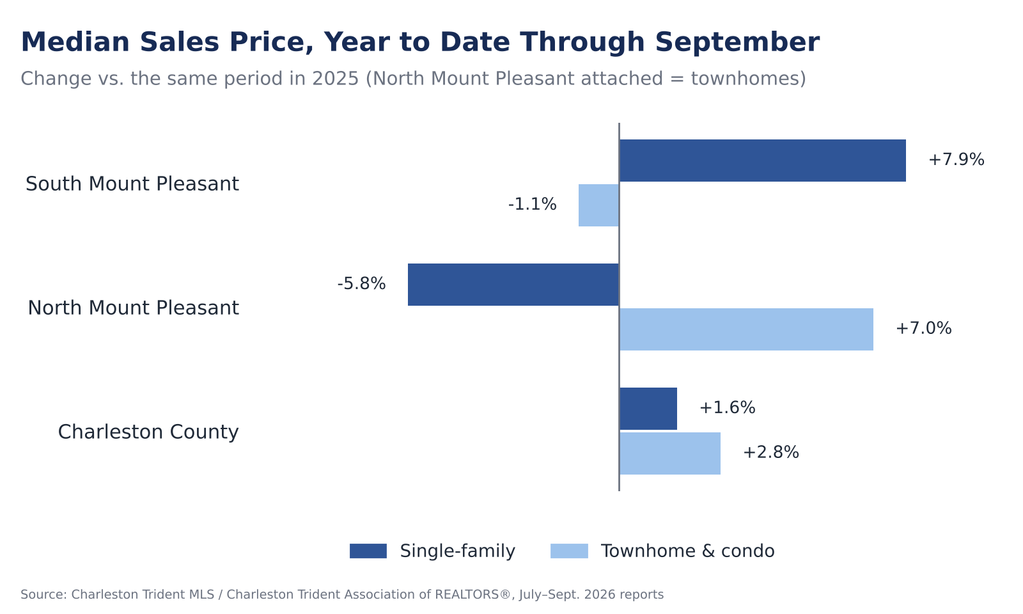
Through September, the single-family median was $1,294,500 in South Mount Pleasant, $980,000 in North Mount Pleasant, and $725,000 countywide. A median reflects which homes sold, not just what any single home is worth, so the most reliable read on your own home's value is recent sales in your neighborhood.
What Q3 Means for Buyers
If you're shopping for a single-family home in Mount Pleasant, you have fewer homes to choose from than last fall, with inventory down roughly a fifth in both North and South Mount Pleasant. What you may have is a bit more time. Homes are spending longer on the market, and in September single-family sellers in all three areas received about 95% of original list price. That figure reflects price reductions made before a sale as well as negotiation, so it doesn't mean every seller will take 5% off. It does mean the list price is a starting point, and part of our job is showing you what comparable homes have actually sold for.
If a townhome or condo fits your plans, Mount Pleasant offers more choice than it did a year ago, with attached inventory up in both North and South Mount Pleasant.
What Q3 Means for Sellers
Fewer competing single-family listings work in your favor, but longer market times and sale prices averaging about 95% of original list price are a reminder that pricing has to be grounded in what's actually closing nearby. In North Mount Pleasant, single-family homes spent 55 days on market until sale in September, so plan your timeline with that pace in mind.
If you're selling a townhome or condo in Mount Pleasant, expect more competition. Attached inventory is up in both North and South Mount Pleasant compared with last September. With more listings to compare against, how your home is priced and presented relative to the others matters more.
Frequently Asked Questions
Are home prices going up in Mount Pleasant in 2026?
It depends on the area. Through September 2026, the year-to-date median single-family sales price was up 7.9% in South Mount Pleasant, to $1,294,500, and down 5.8% in North Mount Pleasant, to $980,000, according to Charleston Trident MLS data. Across Charleston County, the median rose 1.6% to $725,000.
How long does it take to sell a home in Mount Pleasant right now?
In September 2026, single-family homes spent 43 days on market until sale in South Mount Pleasant and 55 days in North Mount Pleasant, both longer than September 2025. Across Charleston County, the figure was 49 days.
Is there more housing inventory in Mount Pleasant than last year?
For single-family homes, no. September 2026 inventory was 133 homes in South Mount Pleasant (down 22.2%) and 151 in North Mount Pleasant (down 18.8%). For attached homes, yes: South Mount Pleasant had 71 townhomes and condos for sale (up from 61), and North Mount Pleasant had 59 townhomes (up from 47).
Where does this market data come from?
From the Charleston Trident Association of REALTORS® Local Market Update reports for July, August, and September 2026, which are compiled from Charleston Trident MLS data by ShowingTime Plus. September figures are current as of October 9, 2026.
The Bottom Line
Q3 2026 left Mount Pleasant with fewer single-family homes for sale than a year ago, prices that held or rose in most segments, and homes that took longer to sell as the market moved into its usual late-summer slowdown. Townhomes and condos are the exception on supply, with more choice in both North and South Mount Pleasant. For buyers, that means a little more time and a list price that's a starting point. For sellers, it means pricing to what's closing nearby from day one.
Questions About Your Corner of Mount Pleasant?
Area-wide numbers are a starting point. What matters for your decision is what's happening on your street and in your price range.
Thinking about selling?
Fewer Listings, Longer Days on Market: How Mount Pleasant's Real Estate Market Wrapped Up Summer 2026
Single-family listings got scarcer across Mount Pleasant and Charleston County this summer, yet homes took longer to sell. Here's what July, August, and September 2026 MLS data shows for North Mount Pleasant, South Mount Pleasant, and the county, and what it means if you're buying or selling this fall.
How Did the Mount Pleasant Real Estate Market Perform in Q3 2026?
Through the third quarter of 2026, single-family supply tightened across Mount Pleasant and Charleston County while homes took longer to sell. In September, single-family inventory was down 22.2% year over year in South Mount Pleasant, 18.8% in North Mount Pleasant, and 7.5% countywide, yet days on market rose in all three. Prices held up: the September median single-family sales price was $1,375,000 in South Mount Pleasant (up 14.6%), $995,000 in North Mount Pleasant (up 3.1%), and $715,000 across Charleston County (up 1.6%). Townhomes and condos moved the other way on supply, with more homes for sale in both North and South Mount Pleasant than a year ago.
September 2026 at a Glance
Single-family prices were up year over year in all three markets in September, with South Mount Pleasant posting the largest gain.
On the attached side, September medians were $490,000 for South Mount Pleasant townhomes and condos, $560,000 for North Mount Pleasant townhomes (on just 12 sales), and $457,450 for townhomes and condos countywide.
The bigger story is supply. Single-family inventory fell in all three markets, while townhome and condo inventory rose in both North and South Mount Pleasant.
How July and August Led Up to September
Homes took longer to sell as the quarter went on, most noticeably in North Mount Pleasant.
Part of that is the usual seasonal slowdown. As back-to-school schedules take over in late summer, the pool of active buyers thins, and days on market lengthened over the same months in 2025 too. The difference this year is that every month ran slower than the year before in North Mount Pleasant and countywide.
South Mount Pleasant had a busier quarter than last year, while North Mount Pleasant townhome sales slowed.
Countywide, 1,469 single-family homes and 478 townhomes and condos closed in Q3, both up from last year.
Year-to-Date Through September: The Bigger Picture
A single month's median can jump around depending on which homes happened to sell that month. Year-to-date figures smooth out those swings. North Mount Pleasant is the one area where the single-family median sits below 2025.
Through September, the single-family median was $1,294,500 in South Mount Pleasant, $980,000 in North Mount Pleasant, and $725,000 countywide. A median reflects which homes sold, not just what any single home is worth, so the most reliable read on your own home's value is recent sales in your neighborhood.
What Q3 Means for Buyers
If you're shopping for a single-family home in Mount Pleasant, you have fewer homes to choose from than last fall, with inventory down roughly a fifth in both North and South Mount Pleasant. What you may have is a bit more time. Homes are spending longer on the market, and in September single-family sellers in all three areas received about 95% of original list price. That figure reflects price reductions made before a sale as well as negotiation, so it doesn't mean every seller will take 5% off. It does mean the list price is a starting point, and part of our job is showing you what comparable homes have actually sold for.
If a townhome or condo fits your plans, Mount Pleasant offers more choice than it did a year ago, with attached inventory up in both North and South Mount Pleasant.
What Q3 Means for Sellers
Fewer competing single-family listings work in your favor, but longer market times and sale prices averaging about 95% of original list price are a reminder that pricing has to be grounded in what's actually closing nearby. In North Mount Pleasant, single-family homes spent 55 days on market until sale in September, so plan your timeline with that pace in mind.
If you're selling a townhome or condo in Mount Pleasant, expect more competition. Attached inventory is up in both North and South Mount Pleasant compared with last September. With more listings to compare against, how your home is priced and presented relative to the others matters more.
Frequently Asked Questions
Are home prices going up in Mount Pleasant in 2026?
It depends on the area. Through September 2026, the year-to-date median single-family sales price was up 7.9% in South Mount Pleasant, to $1,294,500, and down 5.8% in North Mount Pleasant, to $980,000, according to Charleston Trident MLS data. Across Charleston County, the median rose 1.6% to $725,000.
How long does it take to sell a home in Mount Pleasant right now?
In September 2026, single-family homes spent 43 days on market until sale in South Mount Pleasant and 55 days in North Mount Pleasant, both longer than September 2025. Across Charleston County, the figure was 49 days.
Is there more housing inventory in Mount Pleasant than last year?
For single-family homes, no. September 2026 inventory was 133 homes in South Mount Pleasant (down 22.2%) and 151 in North Mount Pleasant (down 18.8%). For attached homes, yes: South Mount Pleasant had 71 townhomes and condos for sale (up from 61), and North Mount Pleasant had 59 townhomes (up from 47).
Where does this market data come from?
From the Charleston Trident Association of REALTORS® Local Market Update reports for July, August, and September 2026, which are compiled from Charleston Trident MLS data by ShowingTime Plus. September figures are current as of October 9, 2026.
The Bottom Line
Q3 2026 left Mount Pleasant with fewer single-family homes for sale than a year ago, prices that held or rose in most segments, and homes that took longer to sell as the market moved into its usual late-summer slowdown. Townhomes and condos are the exception on supply, with more choice in both North and South Mount Pleasant. For buyers, that means a little more time and a list price that's a starting point. For sellers, it means pricing to what's closing nearby from day one.
Questions About Your Corner of Mount Pleasant?
Area-wide numbers are a starting point. What matters for your decision is what's happening on your street and in your price range.
Thinking about selling? Get a home value estimate or schedule a seller consultation, and we'll walk through recent sales near you.
Buying in Mount Pleasant? Book a Mount Pleasant buyer consultation or browse our Buyer's Guide.
Just want to talk through the numbers? Reach out to our team anytime.
Warmly,
Lauren, Tina and Gigi | Lauren Zurilla & Associates | Your Charleston Real Estate Experts | The Boulevard Company
Lauren Zurilla & Associates is proud to support equal housing opportunity for all. We are committed to providing services in full compliance with the federal Fair Housing Act and applicable South Carolina fair housing laws, without regard to race, color, religion, sex, national origin, familial status, or disability. Market data is from the Charleston Trident Multiple Listing Service and is deemed reliable but not guaranteed.
Check out this article next